Appearance
Running a simulation
A simulation (or transient run) steps your circuit forward in time and records the signals you asked for. This page covers the toolbar controls, how to start and stop a run, what the progress and warnings mean, and where the results show up.
New to the app? Build something first with The canvas, or follow Your first circuit end to end.
The simulation toolbar
Everything you need to run is in the floating toolbar at the top of the canvas.

| Control | What it does |
|---|---|
| Run (▶) | Starts a transient simulation. Turns into a Stop button (■) while a run is in flight. |
| Run load flow (⚡) | Solves the steady-state power flow instead of a transient run. Disabled while a simulation is running. |
| Time Step | The integration step. Defaults to 50 µs. Smaller steps resolve faster dynamics but take longer to run. |
| Duration | How much simulated time to run. Defaults to 0.2 s. |
Each time field has a unit selector — s, ms, µs, or ns — so you can type 50 next to µs rather than 0.00005. The fields are locked while a run is active; stop the run to change them.
Record something first
A run only produces plots for the signals you've marked as observables. Before you run, make sure at least one signal is being recorded — for example:
- drop a Scope on the canvas and add a trace, or
- label a wire, or
- enable a measurement checkbox in a component's properties dialog.
If nothing is recorded, the run still executes, but there's nothing to draw (see the warning below).
Starting a run
Click Run. Before stepping, NumaSim validates the circuit:
If there are blocking errors (an unpaired transmission line, a duplicate signal name, and so on), the run is refused and a message appears:
Cannot start simulation: N circuit validation error(s). Fix them and press Play again.
Click Show logs to see each problem; many entries highlight the offending component on the canvas when clicked.
If validation passes, the engine initializes and starts stepping. A progress bar appears under the toolbar and walks through its phases:
- Initializing… — setting up the run (allocating state).
- Running… — stepping, before the first block of results drains.
- 21% — determinate progress once results are streaming. While running, a secondary line shows the speed as a multiple of real time (e.g.
1.84× realtime).

To end a run early, click Stop (■). The bar shows Stopping…, then Stopped at the percentage it reached; whatever was computed so far stays on the scope. If a run fails, the bar shows Error and the details land in the logs.
"Nothing is being recorded"
If you run with no observables, the simulation still runs but warns you that it won't produce any plots:
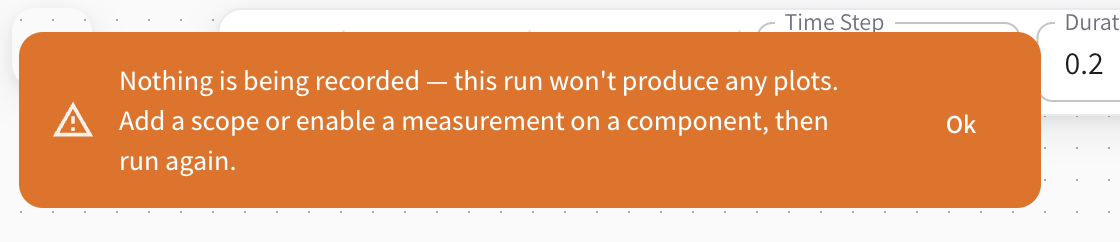
Nothing is being recorded — this run won't produce any plots. Add a scope or enable a measurement on a component, then run again.
Add a scope or turn on a measurement, then run again to get traces.
Reading the results
Results appear the moment they start streaming — you don't wait for the run to finish:
- Scope panel — the oscilloscope that slides up from the bottom. Add traces, zoom, and pan while data streams. See Scope panel.
- On-canvas displays — Plot and Study Desk components render inline, and live widgets (meters, indicator lights) update as the run proceeds.
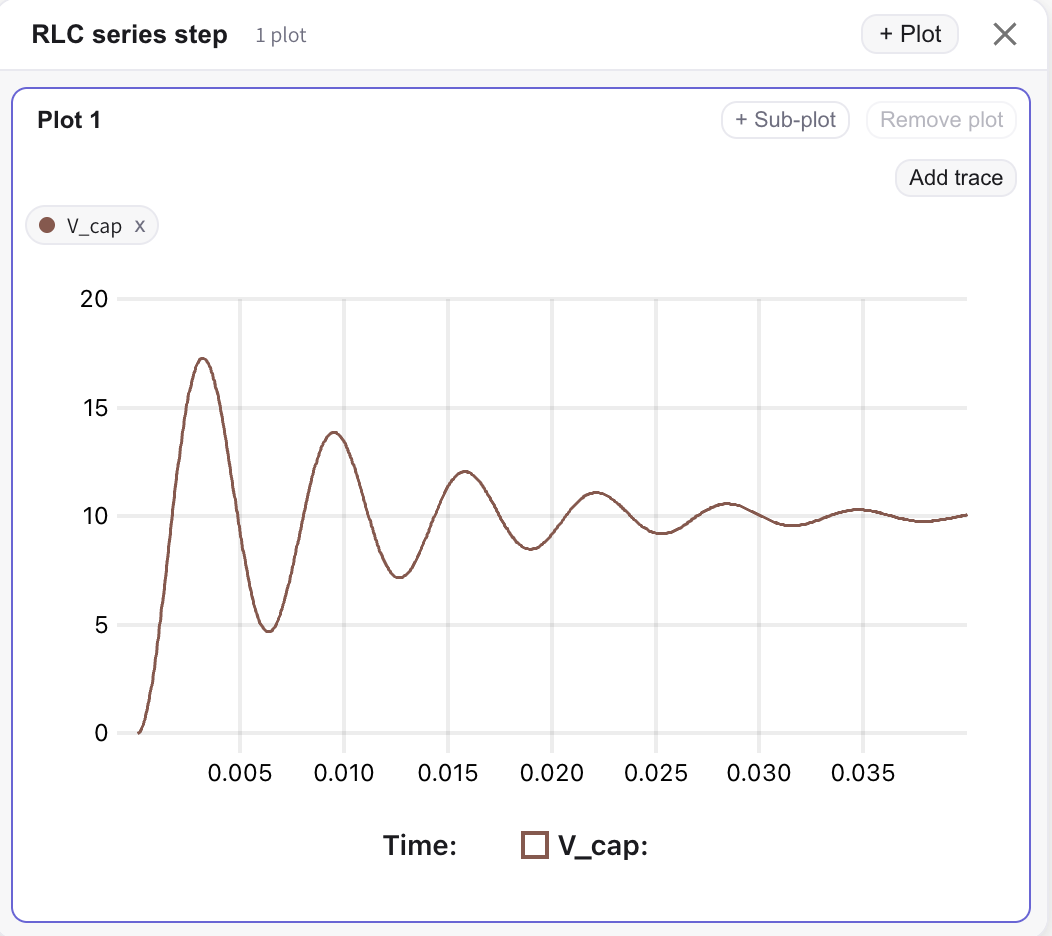
Each click of Run shows one run at a time and replaces the previous data — the trace list is kept, only the samples behind each trace are refreshed. To compare two runs, export the result CSV between them and overlay offline.
Where the run happens
By default the simulator runs locally in your browser via WebAssembly — nothing leaves your machine. If your plan includes cloud simulation, a toggle in the toolbar lets you switch between local (in-browser) and cloud execution for larger or longer runs.
Logs
Open the menu (☰) and choose Show logs to open the log panel. It collects engine messages, validation errors, and warnings for the current run — the first place to look when a run is refused or a result looks wrong.
See also
- The canvas — build and place components.
- Observables — declare what gets recorded.
- Scope panel — work with traces while a run streams.
- Power flow — solve the steady state with the ⚡ button instead of a transient run.